You’re doing the work.
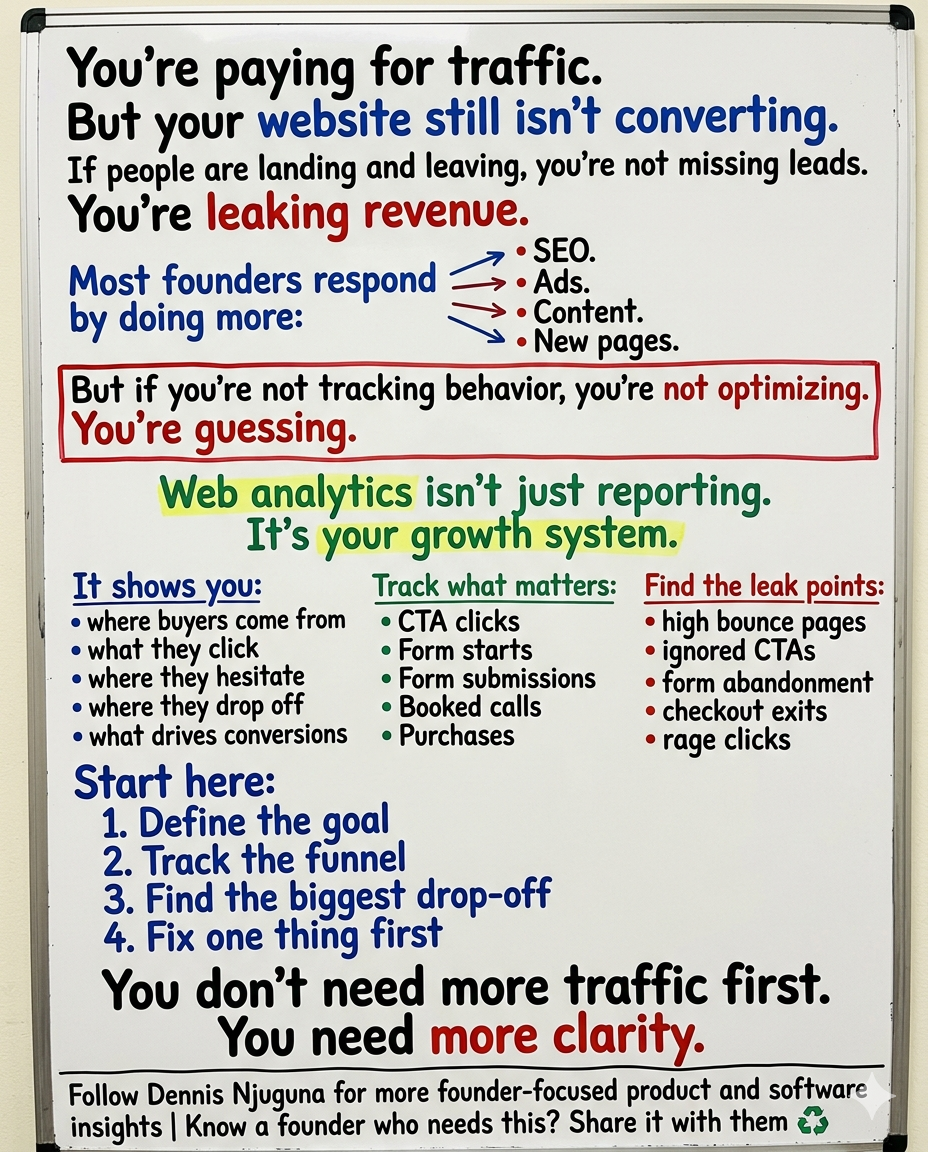
You’re paying for traffic.
You’re publishing content.
You’re refining your offer.
You’re sending people to your website.
And still, the site is underperforming.
That usually leads to one of two reactions.
Either you assume you need more traffic.
Or you assume your website “just needs a redesign.”
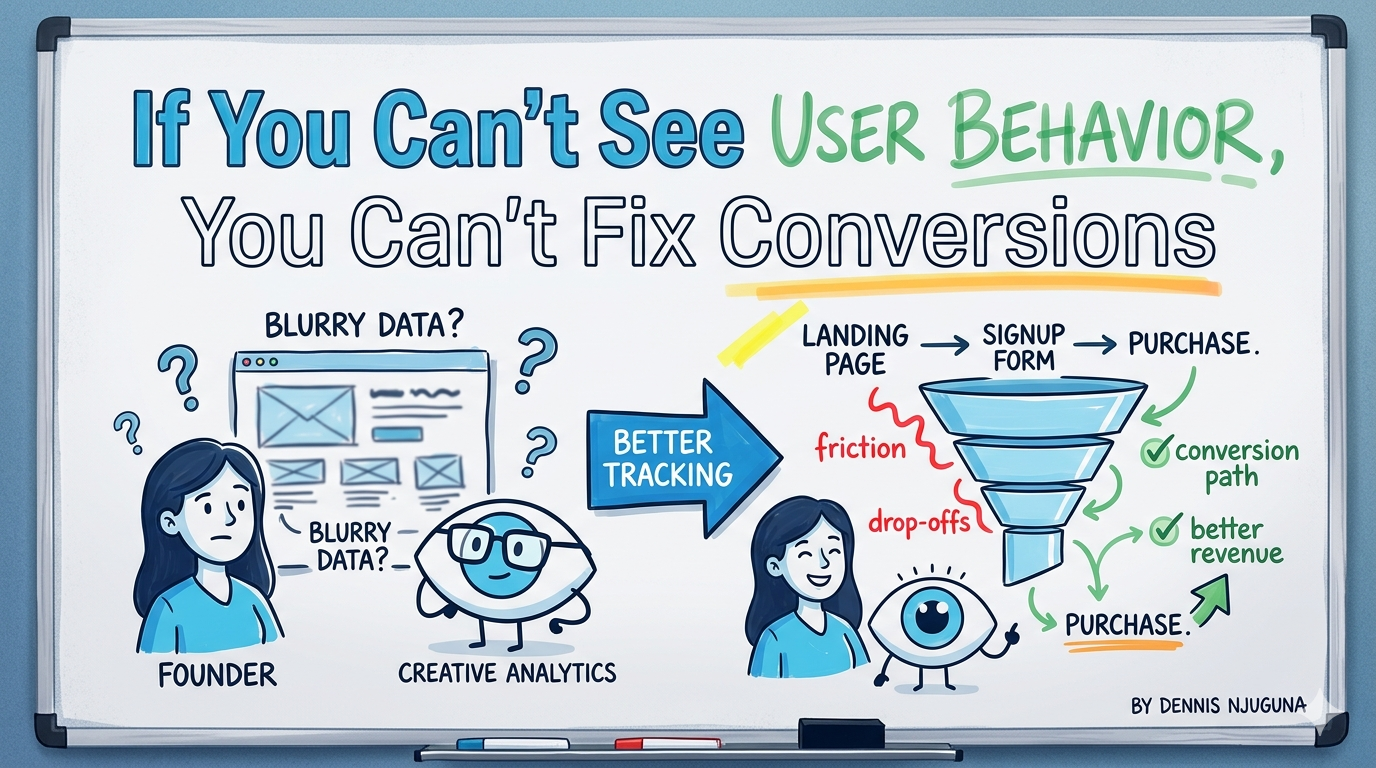
But here’s the harder truth: In a lot of cases, your biggest problem is neither traffic nor design. It’s that you cannot clearly see what visitors are doing between landing and leaving.
That is exactly where website conversion tracking matters.
Because when people visit your site and do not book a call, request a demo, start a checkout, or submit a lead form, your business is not just “missing opportunities.” It is leaking revenue somewhere inside the journey.
And if you are not tracking that journey properly, you are not optimizing.
You are guessing.
That matters more than ever. Unbounce’s 2025 benchmark, based on 464 million visits, 41,000 landing pages, and 57 million conversions, found the median landing page conversion rate across industries was 6.6% as of Q4 2024. In other words, most pages already convert only a small slice of visitors, so hidden friction does not need to be dramatic to become expensive.
What website conversion tracking actually means
A lot of founders hear “conversion tracking” and think of one dashboard, one analytics script, or one green line trending up.
That is not enough.
Website conversion tracking is the discipline of measuring the actions that matter to revenue, then connecting those actions to the pages, devices, channels, and friction points that shaped them.
In Google Analytics, a key event is an event that measures an action particularly important to the success of your business. Google also makes clear that while some events are collected automatically, recommended and custom events must be configured if you want more useful reporting.
That distinction is important.
Because most teams install GA4, see page views rolling in, and assume they have visibility.
Usually, they do not.
They have partial visibility.
And partial visibility is dangerous because it creates false confidence.
Why this matters right now
Recent benchmarks show the cost of weak visibility is rising.
Contentsquare’s 2025 Digital Experience Benchmarks reported a 6.1% year-over-year drop in conversions, while also finding that more disciplined organizations, the ones actively monitoring and managing digital experience, reduced friction 4.5x more effectively, cut load-time frustration by 22%, and reduced rage clicks by nearly 5%. Sites that increased session depth by 10% or more also saw an average 5.4% lift in conversions.
That is the shift founders need to understand: Better conversion performance is not only about acquiring traffic.
It is about understanding what happens after the click and removing the friction that blocks intent.
The behavioral gap most founders are operating with
Here is what often happens inside growing companies.
You know how many people visited the site.
You know which campaign brought them there.
You may even know which page got the most traffic.
But you do not know:
- Where serious buyers hesitate.
- Which CTA gets ignored.
- Which form field creates friction.
- Which page works on desktop but underperforms on mobile.
- Which returning visitors are most likely to convert.
- Which traffic sources drive action instead of empty visits.
That is not a small gap.
That is the entire commercial story.
And recent benchmark data backs that up. Contentsquare’s 2026 conversion analysis, based on 99 billion web and app sessions across 6,000+ sites, found that returning visitors convert at 2.9% versus 1.7% for new visitors, while mobile drives 69.9% of traffic, but desktop conversion rates are 74% higher than mobile. That means “more traffic” is often the wrong question; device context, visitor type, and post-click experience matter just as much.
What most businesses get wrong with website conversion tracking
The most common mistake is simple: They track activity.
They do not track outcomes.
That sounds subtle, but it changes everything.
Tracking activity is measuring page views, sessions, scroll depth, and maybe a few button clicks.
Tracking outcomes is measuring the moments tied directly to growth:
- Booked calls.
- Qualified leads.
- Demo requests.
- Checkout starts.
- Purchases.
- Contact form submissions.
- Successful onboarding steps.
Google’s own documentation reflects this logic: events become valuable when they are mapped to what is important to the business, not just what is easy to collect.
So when a company says, “We have analytics,” what I usually want to know is: Do you actually track the conversion path end to end, or are you just counting visitors?
Where revenue usually leaks
In practice, leaks show up in a handful of places.
The first is friction in critical flows.
Baymard’s 2025–2026 checkout research still puts average documented cart abandonment at about 70.2%, and its benchmark data says 18% of US online shoppers have abandoned an order because checkout was too long or complicated. Baymard also found the average US checkout flow shows 23.48 form elements by default, while an ideal checkout can be as short as 12–14 form elements.
The second is performance.
Google’s mobile speed research found that 53% of mobile visits are abandoned if a page takes longer than 3 seconds to load, and bounce rates rose from about 13% under 3 seconds to nearly 60% at 9 seconds. In the same Google material, a SOASTA study found that pages loading 1 second faster saw conversion rates improve by up to 27%. The performance study is older, but it remains one of the clearest pieces of evidence that speed is not a technical vanity metric; it is a revenue variable.
The third is poor follow-through after buyer intent appears.
Someone clicks a CTA.
Starts a form.
Visits pricing.
Returns twice.
And still does not convert.
That is where raw analytics stops being enough on its own. You need behavioral context, the why behind the drop-off, which is where tools like heatmaps, session recordings, and journey analysis become useful. Contentsquare’s current benchmark guidance explicitly recommends behavioral analytics to understand where visitors hesitate and drop off, especially for high-intent traffic and cross-device journeys.
What a production-grade website conversion tracking setup looks like
This is where a lot of teams overcomplicate things.
A strong setup is not about collecting everything.
It is about collecting the right things reliably.
A production-grade website conversion tracking system usually has five parts.
1. Clear conversion definitions
You decide what actually counts.
For one business, that might be a booked discovery call.
For another, it might be checkout completion.
For another, it might be a demo request plus qualification.
You do not start with dashboards.
You start with outcomes.
2. End-to-end funnel tracking
You map the path, not just the endpoint.
For example:
Landing page → pricing page → CTA click → form start → form submit → meeting booked
Or:
Landing page → product page → add to cart → checkout start → purchase
This is where website conversion tracking becomes useful, because it shows you not just whether people convert, but where they stop.
3. Event taxonomy that engineering can trust
This is the part most teams skip.
Your events need consistent names, clear parameters, and a structure that survives redesigns, campaign changes, and product updates.
Google recommends using recommended events and parameters where possible, and adding custom events where needed. Google also supports server-to-server measurement through the Measurement Protocol to augment automatic collection with offline or server-side interactions.
That matters if you want tracking that is more reliable than a pile of front-end tags glued together over time.
4. Validation and QA
If your event fires twice, fires late, or fires on the wrong condition, your reporting becomes fiction.
Google provides validation tools specifically because event collection needs testing before you trust it in reports.
This is one of the biggest differences between hobby tracking and serious tracking.
5. Decision-ready reporting
Dashboards should answer questions like:
- Which pages create the biggest drop-off?
- Which traffic sources produce qualified conversions?
- Which device segments underperform?
- Which return-visit journeys convert best?
- What changed after the last site update?
That is when analytics becomes operational.
Not reporting for reporting’s sake.
A system you can actually steer growth with.
What to track first if your setup is messy
Do not start with twenty events.
Start with five.
For most founder-led businesses, that is enough to create clarity:
- CTA click
- Form start
- Form submit
- Discovery call booked
- Purchase or qualified lead created
Then add context:
- traffic source
- landing page
- device type
- new vs returning visitor
- error state or abandonment step
That small layer often gives you more useful insight than a bloated analytics implementation nobody fully trusts.
What the data says good optimization looks like
This is the part people miss.
Optimization is not about random tweaks.
It is about removing friction at the exact point where intent is already present.
Baymard says large e-commerce sites can see an average 35% increase in conversion rate from better checkout design alone. Contentsquare’s 2025 benchmarks show that reducing friction and increasing engaged session depth correlate with conversion lifts. And Google’s performance research shows speed still materially affects both bounce and conversion.
That is why the right question is rarely: “How do we get more traffic?”
It is usually: “Where are we losing people who were already interested?”
That is a much better growth question.
And it usually leads to much better product and engineering decisions.
The founder takeaway
Your website does not need to be louder.
It needs to be clearer.
Because when you can see behavior clearly, you stop arguing from opinion.
You stop redesigning blindly.
You stop paying for traffic you cannot convert.
And you start making changes that compound.
That is the work that matters.
If your site is getting attention but not turning enough of that attention into booked calls, leads, or revenue, that is usually not a mystery.
It is a measurement problem first.
And measurement problems can be fixed.
Next article
No next article
Share this article
Send it to someone who would find it useful.